Remember to Benchmark!
In a previous blog article, I wrote of writing a new backend for the hex editor. However, something seems missing: An actual benchmark.
I last wrote:
reasonable assumption that there will be up to a few hundred edits
Well, why not test that? I wrote a quick benchmark that performs 100 replace operations at different positions (+2 to avoid coalescing) and reports statistics, repeated 30 times.
Our benchmark is built using build options “unittests”, “optimize”, “inline”, and “debugInfo”.
Running our benchmark using the LDC compiler under a Glibc 2.39 + Linux 6.14 system yields this result:
--------------------------------
GC.free        : 4.99 MiB
GC.used        : 8.31 KiB
GC.alloc       : 8.23 KiB
--------------------------------
  +100 replaces: 760.299 μs (7 hnsecs each)
  +100 replaces: 2.246 ms (2.200 μs each)
  +100 replaces: 6.118 ms (6.099 μs each)
  +100 replaces: 7.831 ms (7.799 μs each)
  +100 replaces: 6.214 ms (6.200 μs each)
  +100 replaces: 7.383 ms (7.299 μs each)
  +100 replaces: 17.347 ms (17.300 μs each)
  +100 replaces: 11.352 ms (11.300 μs each)
  +100 replaces: 27.632 ms (27.600 μs each)
  +100 replaces: 13.327 ms (13.300 μs each)
  +100 replaces: 14.451 ms (14.400 μs each)
  +100 replaces: 16.213 ms (16.199 μs each)
  +100 replaces: 49.773 ms (49.700 μs each)
  +100 replaces: 19.242 ms (19.199 μs each)
  +100 replaces: 20.942 ms (20.899 μs each)
  +100 replaces: 24.977 ms (24.899 μs each)
  +100 replaces: 28.338 ms (28.300 μs each)
  +100 replaces: 29.484 ms (29.399 μs each)
  +100 replaces: 100.769 ms (100.700 μs each)
  +100 replaces: 29.588 ms (29.500 μs each)
  +100 replaces: 29.344 ms (29.300 μs each)
  +100 replaces: 30.757 ms (30.699 μs each)
  +100 replaces: 31.814 ms (31.800 μs each)
  +100 replaces: 33.353 ms (33.299 μs each)
  +100 replaces: 34.414 ms (34.399 μs each)
  +100 replaces: 36.118 ms (36.100 μs each)
  +100 replaces: 37.509 ms (37.500 μs each)
  +100 replaces: 201.015 ms (201 μs each)
  +100 replaces: 41.530 ms (41.500 μs each)
  +100 replaces: 42.378 ms (42.299 μs each)
--------------------------------
view(pos=0,size=400): 3 μs and 1 hnsec
view(pos=10_000,size=400): 2 hnsecs
GC.free        : 4.96 MiB
GC.used        : 838.03 MiB
GC.alloc       : 824.94 MiB
Oh, oh no. That is bad. A total of 3,000 edits (30 runs of 100 replace operations) makes up almost a gigabyte of memory.
For the fun of it, let’s put the execution times on a chart:
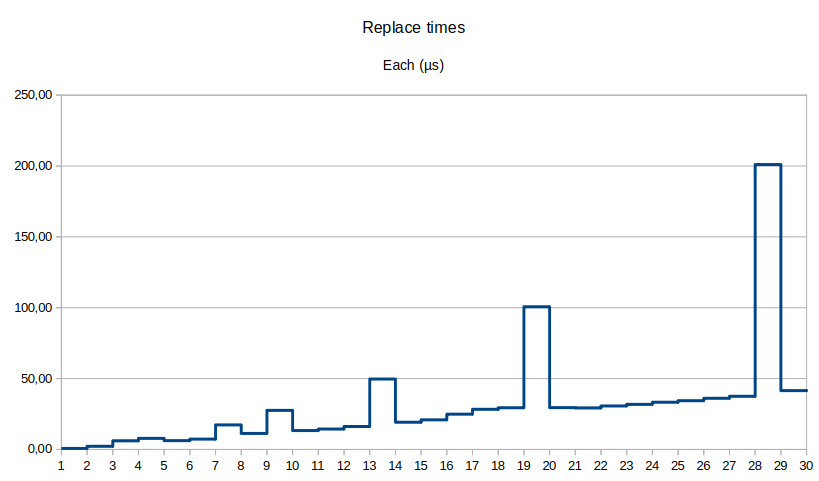
Other observations:
- Spikes look like the GC kicks in for that batch of edits;
- It’s very busy, and rather pressured so by us.
- The amount of time for each insert slowly increases, but are still fast on average (42-200 µs);
- The view function is still fast (all data in-memory): 200 ns to 3 µs;
- And GC free heap space is usually 5 to 10 MiB.
Retrying with different amounts of edits (using DMD this time):
- 100: 1.16 MiB used
- 200: 3.98 MiB
- 300: 8.67 MiB
- 400: 15.21 MiB
- 500: 23.61 MiB
- 1,000: 93.53 MiB
- 2,000: 372.87 MiB
- 3,000: 838.23 MiB
- 4,000: 1.45 GiB – 2.3 seconds
Using LDC, with 4,000 edits, its memory usage spikes up to 1.45 GiB with an execution time of 1.778 seconds. Fortunately, that’s on a powerful Ryzen 9 5950X system.
But, how about a weaker one? On a Pentium N5000 Silver (~67.5% worse single-core performance) with 4,000 edits, well, we get 11.84 seconds (~3 ms each, using DMD on a Glibc 2.41+Linux 6.14 system) with the same amount of memory used.
To be fair, while thousands of edits makes for extremely lengthy sessions, they are still realistically achievable. And like with text editors, someone is bound to eventually reach this sort of limit.
The issue? This seems to be mostly a memory usage issue. Since we still have good execution times, we could trade in execution speed for memory usage. So, what are our options?
- Save snapshot information on disk:
- Overkill and adds I/O latency.
- Doesn’t solve the root issue, and we’d still be writing a lot to the disk.
- Interesting idea for session restoration or extremely long sessions (10K+ edits).
- Switch to arrays:
- Arrays would help lower per-node allocation overhead.
- Still doesn’t solve the root issue and increases execution time (O(n) for anything).
- Full snapshots with tree cloning (Copy-on-Write):
- Cloning (CoW) should help in theory, but does not guarantee itself as a fix.
- Still have to remove and re-insert keys due to cumulative updates.
- Claude says: ~200 MB + O(n) for clone.
- Optimistic guess for 4,000 edits.
- Excludes O(log n) for each indexed piece to update.
- Deltas:
- Work with a single tree, and save all affected pieces.
- Save range of affected pieces. Retains fast undo-redo operations.
- Claude says: ~200 KB + O(log n).
- Optimistic guess for 4,000 edits.
- Hybrid Snapshots+Deltas:
- Holds tree snapshots every so number of edits, making it more complex.
- Main advantage of faster execution times when undoing over a larger distance.
- e.g., undoing 500 edits only requires getting the nearest snapshot without undoing a lot of changes.
- Claude says: ~5 MB + O(log n) average.
- Optimistic guess for 4,000 edits.
- Command History
- Akin to deltas, but only save new and removed pieces, not all affected pieces.
- Absolute minimal memory usage, lower than deltas (which are partial trees).
- Simplest and seems best towards fixing goal.
Fixing the Root Issue
At the time of writing, I got curious for benchmarking and realized this issue while ddhx 0.7 beta 1 is out.
Being worried about attempting to optimize the back end (in a beta of all thing), breaking the current implementation I’ve already worked so hard on, is a pretty valid sentiment. I’ve decided to push the decision to optimize for the next version. No biggie, 1,000 edits is still an exceptionally lengthy session.
Now, for ddhx 0.8.
The best consideration at this moment is command history, because it is the most immediate way to tackle the memory usage issue, and leaves room to see if other performance issues arise in later tests.
Considering:
- Editing and viewing are mostly unaffected in execution time;
- Undo-redo travel distances are typically very short (rare to undo all);
- It is simpler than a hybrid snapshot system;
- Memory constraints go from O(n) to O(k) where 1–5 pieces are saved;
- And we trade undo-redo execution time from O(1) to O(n).
Implementing a command history is rather simple in principle:
- For a new history entry, create a new operation.
- Read the current structure, gather pieces to add and remove for the operation.
- When done, apply the operation changes to the tree atomically.
- Save operation in history.
- Debug-only: Check tree consistency.
Undo-redo is still as simple as moving the historical index and perform the operation selected.
After finishing the new Piece V2 backend, passing all the same tests as the old one, it was time to test it.
Benchmark… NOW
By the time the new backend was finished, I readapted the benchmark code to become a submodule (with its own getopt), so I can select multiple backends and be able to eventually specify additional arguments, or different tests.
This time, the benchmark is running without optimizations and with the piece consistency checker, using the DMD compiler. The output prints the total amount of replace operations performed so far and the time it took for the batch (a “round” contains many “runs” in my lingo).
Old “piece” (0.7) backend:
BACKEND: piece
ROUNDS : 30
RUNS   : 100
--------------------------------
GC.free        : 4.98 MiB
GC.used        : 12.40 KiB
GC.alloc       : 8.32 KiB
--------------------------------
   100 replaces: 1.881 ms (1.800 μs each)
   200 replaces: 7.040 ms (7 μs each)
   300 replaces: 11.852 ms (11.800 μs each)
   400 replaces: 14.349 ms (14.300 μs each)
   500 replaces: 22.082 ms (22 μs each)
   600 replaces: 23.248 ms (23.199 μs each)
   700 replaces: 27.759 ms (27.699 μs each)
   800 replaces: 40.304 ms (40.299 μs each)
   900 replaces: 36.875 ms (36.799 μs each)
  1000 replaces: 41.447 ms (41.399 μs each)
  1100 replaces: 45.790 ms (45.700 μs each)
  1200 replaces: 68.796 ms (68.700 μs each)
  1300 replaces: 55.640 ms (55.600 μs each)
  1400 replaces: 60.630 ms (60.600 μs each)
  1500 replaces: 65.287 ms (65.200 μs each)
  1600 replaces: 69.382 ms (69.299 μs each)
  1700 replaces: 111.900 ms (111.900 μs each)
  1800 replaces: 78.915 ms (78.900 μs each)
  1900 replaces: 84.138 ms (84.099 μs each)
  2000 replaces: 88.498 ms (88.400 μs each)
  2100 replaces: 93.287 ms (93.200 μs each)
  2200 replaces: 98.088 ms (98 μs each)
  2300 replaces: 102.938 ms (102.900 μs each)
  2400 replaces: 190.007 ms (190 μs each)
  2500 replaces: 112.528 ms (112.500 μs each)
  2600 replaces: 118.105 ms (118.099 μs each)
  2700 replaces: 123.231 ms (123.200 μs each)
  2800 replaces: 127.787 ms (127.700 μs each)
  2900 replaces: 132.899 ms (132.800 μs each)
  3000 replaces: 137.971 ms (137.900 μs each)
--------------------------------
view(pos=0,size=400): 12 μs and 8 hnsecs
view(pos=10_000,size=400): 6 hnsecs
GC.free        : 4.00 MiB
GC.used        : 838.99 MiB
GC.alloc       : 824.94 MiB
New “piecev2” (0.8) backend:
BACKEND: piecev2
ROUNDS : 30
RUNS   : 100
--------------------------------
GC.free        : 4.98 MiB
GC.used        : 12.50 KiB
GC.alloc       : 8.42 KiB
--------------------------------
   100 replaces: 593.500 μs (5 hnsecs each)
   200 replaces: 1.498 ms (1.399 μs each)
   300 replaces: 2.242 ms (2.200 μs each)
   400 replaces: 3.012 ms (3 μs each)
   500 replaces: 3.716 ms (3.700 μs each)
   600 replaces: 4.123 ms (4.099 μs each)
   700 replaces: 5.373 ms (5.299 μs each)
   800 replaces: 5.782 ms (5.700 μs each)
   900 replaces: 6.392 ms (6.299 μs each)
  1000 replaces: 7.634 ms (7.599 μs each)
  1100 replaces: 7.724 ms (7.700 μs each)
  1200 replaces: 8.598 ms (8.500 μs each)
  1300 replaces: 9.210 ms (9.199 μs each)
  1400 replaces: 10.224 ms (10.199 μs each)
  1500 replaces: 14.984 ms (14.900 μs each)
  1600 replaces: 13.506 ms (13.500 μs each)
  1700 replaces: 13.946 ms (13.900 μs each)
  1800 replaces: 13.189 ms (13.099 μs each)
  1900 replaces: 14.002 ms (14 μs each)
  2000 replaces: 14.846 ms (14.800 μs each)
  2100 replaces: 15.715 ms (15.699 μs each)
  2200 replaces: 16.673 ms (16.600 μs each)
  2300 replaces: 17.278 ms (17.199 μs each)
  2400 replaces: 18.147 ms (18.100 μs each)
  2500 replaces: 18.809 ms (18.800 μs each)
  2600 replaces: 19.579 ms (19.500 μs each)
  2700 replaces: 20.489 ms (20.399 μs each)
  2800 replaces: 21.428 ms (21.399 μs each)
  2900 replaces: 22.114 ms (22.100 μs each)
  3000 replaces: 23.143 ms (23.100 μs each)
--------------------------------
view(pos=0,size=400): 13 μs and 3 hnsecs
view(pos=10_000,size=400): 5 hnsecs
GC.free        : 9.35 MiB
GC.used        : 2.64 MiB
GC.alloc       : 2.06 MiB
Well! Isn’t that some good work?
Take-aways:
- View time remains unchanged, as expected;
- Replace operation execution times were reduced by 6 times;
- Used memory by the GC reduced by 318 times(!);
- GC spikes are more tame (noticed a spike in batch 1500);
- And GC free memory increased – Perhaps the GC anticipated more usage after a collection.
- Versus potentially many more in the older version.
This is plenty ready to be included in ddhx 0.8!
New New Limitations
While this new backend makes me happy, we’re still trading O(1) to O(n) when undoing or redoing the history. Because we accepted the fact that history traveling is typically short for just “simple” editing.
For example, taking one replace operation to be 23 µs (worst) with 3,000 pieces mean 3,000 * 23 µs = 69 ms (in theory) to undo everything at once on a fast Ryzen 9 5950X processor. Assuming 67% single-core performance, that means ~115.23 ms total. That’s fine, for now. (Don’t jinx it!)
A new benchmark will be required when undo-redo becomes problematic. By then, I’ll consider a hybrid command-snapshot approach.
But, until then: Don’t fix it if it ain’t broke, and have a good one.